As data and usage grow, apps adopt distributed microservices with load balancers for scalability. Monitoring error rates, resource use, and replica health across instances is crucial. Tools like Prometheus aid in ensuring uptime and performance.
As internet users and data proliferate at an unprecedented rate, modern applications and services have surpassed the capabilities of single-server deployments. To accommodate the escalating demands of their expanding user bases, contemporary applications are increasingly adopting a distributed microservices architecture.
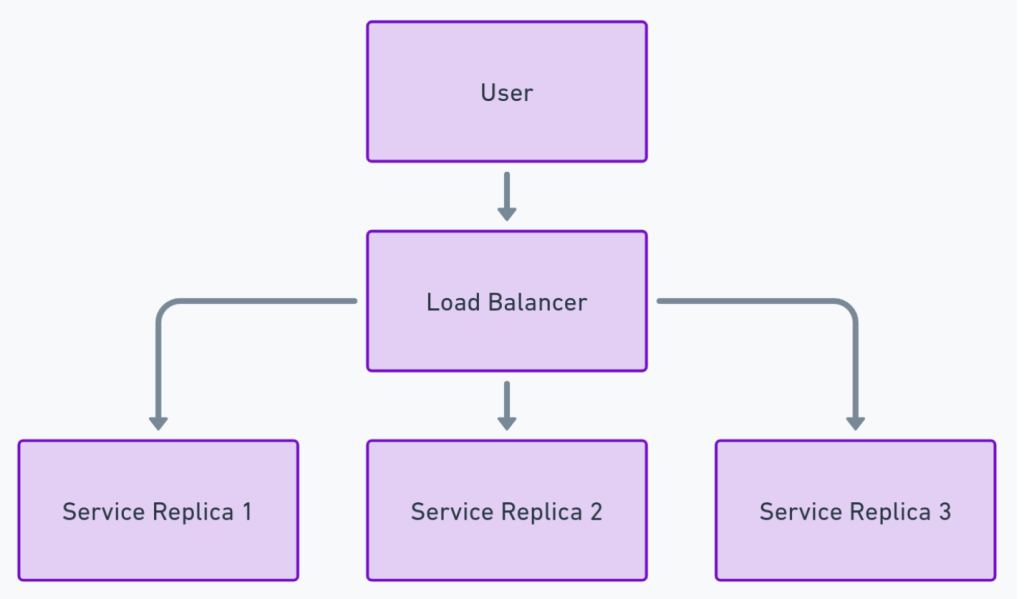
A common pattern for synchronous microservices involves deploying multiple replicas behind a load balancer. Users and client services send requests to the load balancer, which routes each request to one of the available replicas. While this approach enhances scalability and fault tolerance, it introduces monitoring challenges not present in single-node systems.
In a single-node environment, operators can directly observe requests and monitor the health of the node using tools like the Linux top utility. This allows for straightforward scaling decisions and issue detection. However, this methodology does not scale when dealing with microservices comprising hundreds of replicas.
In this article, we explore various failure modes in distributed microservices and discuss approaches to proactively monitor them, ensuring consistent uptime for upstream users and clients.
Challenge #1: Aggregate error and fault rate of the service
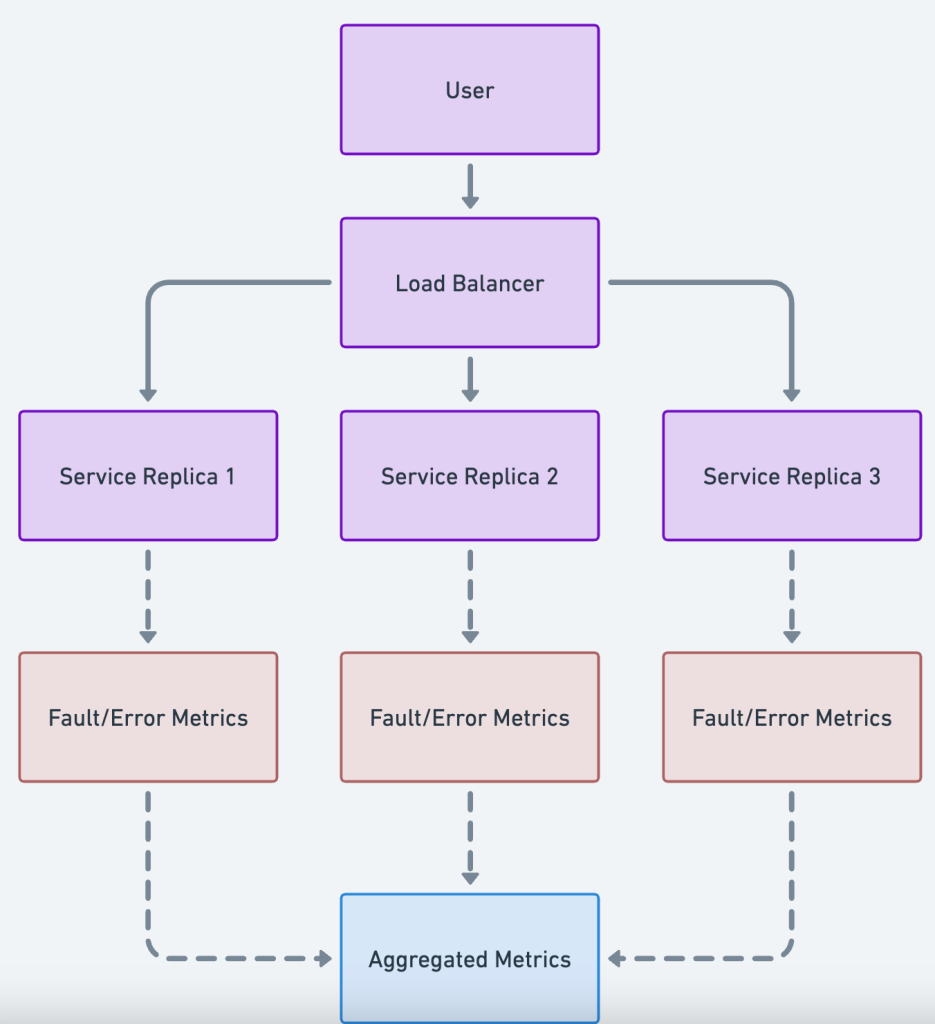
Faults in a microservice can include requests that result in unexpected responses or server-side errors, such as HTTP 5xx response codes. Monitoring these faults is crucial for maintaining the reliability and performance of your service. In a distributed system with multiple replicas, it’s important to aggregate fault metrics across all instances to get a holistic view of the service’s health.
General Approach to Monitoring Fault Rates
- Metric Emission: Each service replica should emit metrics related to the response codes it generates. This includes counts of successful responses, client errors (HTTP 4xx), and server errors (HTTP 5xx).
- Aggregation: Collect and aggregate these metrics across all replicas to calculate the overall fault rate of the service. This helps identify systemic issues affecting the service as a whole.
- Visualization and Alerting: Use a monitoring system to visualize fault rates over time and set up alerts that notify operators when fault rates exceed acceptable thresholds.
Monitoring Fault Rates Using Tools
Prometheus is a popular open-source monitoring system that can collect and aggregate metrics from your microservice replicas. Prometheus is just one tool that we’ll use as an example, but the general approach is the same.
Aggregate Metrics: Prometheus scrapes the metrics from all replicas and can aggregate them.
Example Prometheus query to get the aggregate rate of HTTP 5xx errors across all replicas:
sum(rate(http_requests_total{code=~"5.."}))
Drill Down into Faulty Replicas: To identify which replicas are experiencing the most faults, you can group the metrics by the instance label.
rate(http_requests_total{code=~"5.."}) by (instance)
This shows the rate of 5xx errors per instance over the last five minutes.
Monitoring Client Errors (HTTP 4xx)
While HTTP 4xx response codes indicate client-side errors, an unexpected increase might signal issues such as:
- API Misuse: Clients are not using the API correctly.
- Documentation Errors: Incorrect or outdated API documentation leading to improper client requests.
- Service Bugs: Logic errors in the service that misclassify responses.
Monitoring and analyzing these errors can help improve both the service and client integrations.
Challenge #2: Resource utilization issues
Importance of Monitoring CPU and Memory Usage
Monitoring resource utilization metrics like CPU and memory usage is essential for:
- Preventing Performance Degradation: High resource usage can lead to increased response times or service unavailability.
- Detecting Memory Leaks: Gradual increases in memory usage may indicate memory leaks, which can cause crashes.
- Scaling Decisions: Understanding resource usage patterns aids in capacity planning and scaling strategies.
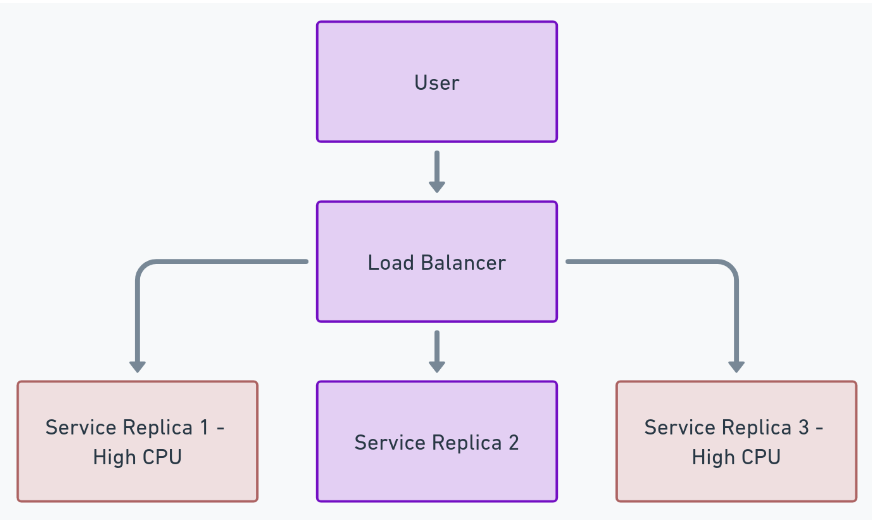
In a distributed environment, resource issues on individual replicas can impact overall service performance, especially if multiple replicas experience issues simultaneously.
General Approach to Monitoring Resource Utilization
- Per-Replica Metrics: Each replica should expose its CPU and memory usage metrics.
- Aggregated View: Collect these metrics to analyze resource utilization trends across all replicas.
- Thresholds and Alerts: Define acceptable resource usage thresholds and set up alerts for when these thresholds are breached.
Monitoring Resource Utilization Using Prometheus
Tools like Prometheus can collect and aggregate resource utilization metrics from each replica. Again, you can use any monitoring tool of your choice but we’ll use Prometheus as an example.
CPU Utilization per Replica:
rate(process_cpu_seconds_total) by (instance)
This calculates the average CPU usage per instance over the last five minutes.
Aggregate CPU Utilization:
Set up alerts to notify operators when resource usage exceeds defined thresholds, enabling proactive mitigation.
Challenge #3: Unhealthy replicas
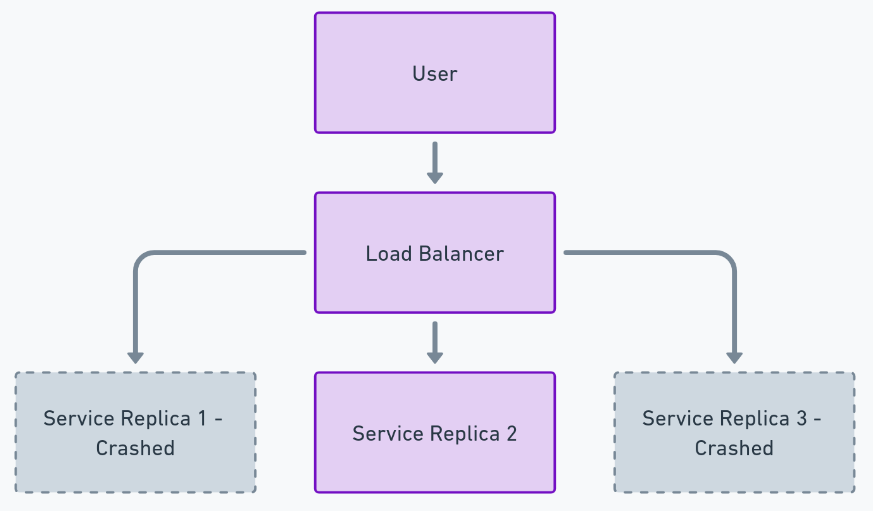
Hardware faults and crashes are inevitable in large-scale distributed systems. A single replica crashing might not impact the overall service, but simultaneous failures of multiple replicas can compromise service availability.
General Approach to Monitoring Replica Health
- Health Checks: Implement regular health checks for each replica to determine its operational status.
- Load Balancer Monitoring: Use the load balancer’s perspective to monitor the health of backend replicas.
- Replica Counts: Keep track of the total number of healthy versus unhealthy replicas.
Monitoring Unhealthy Replicas from the Load Balancer’s Perspective
Load balancers often perform periodic health checks on backend replicas and can provide metrics on their status.
Steps to monitor unhealthy replicas:
- Enable Health Check Metrics: Configure the load balancer to expose metrics about the health of each replica.
- Collect Metrics: Use a monitoring system to collect these metrics.
- Analyze and Alert: Monitor the number of unhealthy replicas and set up alerts if the count exceeds a certain threshold.
Example Using tools like Prometheus
If your load balancer exposes metrics, you can collect and analyze them.
Example queries:
Count of Healthy Replicas:
sum(loadbalancer_backend_up{backend="myservice"})
Assuming loadbalancer_backend_up is a metric indicating if a backend is up (1) or down (0).
Identifying Unhealthy Replicas:
loadbalancer_backend_up{backend="myservice"} == 0
- This query lists all replicas that are currently down.
Summary
Effective monitoring of distributed microservices is vital for ensuring high availability and performance in today’s scalable applications. By aggregating metrics across all service replicas and employing robust monitoring tools, operators can gain deep insights into the system’s health.
Proactive monitoring of error rates, resource utilization, and replica health enables timely detection and resolution of issues, minimizing the impact on end-users. Implementing comprehensive monitoring strategies not only helps maintain service reliability but also contributes to better capacity planning and resource optimization.
As distributed systems continue to grow in complexity, embracing robust monitoring solutions becomes increasingly important. By leveraging both general monitoring principles and specific tools, organizations can enhance their operational capabilities and deliver consistent, high-quality services to their users.
References
- M. Usman, S. Ferlin, A. Brunstrom and J. Taheri, “A Survey on Observability of Distributed Edge & Container-Based Microservices,” in IEEE Access, vol. 10, pp. 86904-86919, 2022, doi: 10.1109/ACCESS.2022.3193102.
- Chinamanagonda, Sandeep. “Observability in Microservices Architectures-Advanced observability tools for microservices environments.” MZ Computing Journal 3.1 (2022).
- Amburri, Damian A., Marco Miglierina, and Elisabetta Di Nitto. “Cloud applications monitoring: An industrial study.” Information and Software Technology 127 (2020): 106376.
RELATED TOPICS
- The Best Ways to Automate SBOM Creation
- Relevance of CI/CD Practices in IT Software Delivery
- Building Your First Web Application with Yii Framework
- Transform Your CAD Workflow with Parametric Modeling
- Power of Cloud App Development, DevOps for Businesses
- Efficiency in a Virtualized World: A Deep Dive into Modern IT


